Chart Indicators
Kubera industry experts have identified 15 chart indicators available to our top tier accounts to help trader excel in their market analysis and enhance their trading strategy.
Chart indicators are a range of tools that assist traders in breaking down complex information. They can select to monitor and analysis charts according to indicators such as timeframe, price movements and others. Kubera chart indicators enable customisation and support the optimisation of the trading strategies.
Mini Chart
With Mini Chart indicator, the traders can create a picture within a picture on the MT4 main display. It enables them to monitor timeframes or price action on different instruments without jumping between various MT4 charts.
Highs And Lows
A chart indicator that displays historic lows and highs. Traders can apply several copies of the indicator to a single chart to monitor different historical levels. Additionally, a daily time range can be selected so that the highs and lows are referred to various trading hours. Traders can also set up a notification if the current price crosses historic lows or highs.

Renko Bars
Renko Bars indicator allows traders to define blocks of different durations/lengths and range blocks. When it is applied to the MT4 platform, this tool supports an offline traditional Renko view, where blocks remain the same on size while the duration on the X-axis becomes variable.

Chart Group
As the name suggests, the Chart Group indicator helps traders create connections between charts, allowing them to change a symbol across all linked charts. Additionally, the indicator enables dynamic change between multiple open positions or CFD instruments and synchronising timeframes, allowing traders to set various groups of charts that still work autonomously.
Symbol Info
Through this indicator traders create a drag-and-drop window in the MT4/5 interface to observe essential information such as the daily percentage change, the lows and highs of the day.
Gravity
Gravity indicator is a visual tool that outlined speculative support and resistance areas in correction with the previous positions. The different colours enable easy recognition of weaker and more robust activity. The Gravity indicator can be used in the current timeline or for a specific time.
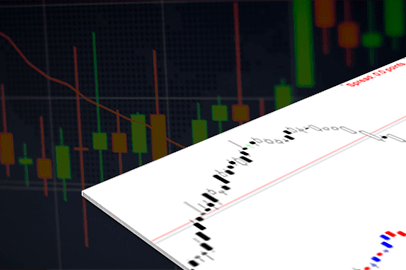
Chart-In-Chart
Chart-in-Chart indicator demonstrates another CFD instrument’s price in a tab within the main window of the active chart. The tool enables traders to overlay multiple accounts over a chart to monitor several instruments simultaneously.

Magnifier
The Magnifier indicator enables traders to set up a scalable easy to drag windows within the primary MT4/5 charts. More so, this window can “zoom in” on particular bars thus lowering the timeframe of that section. In other words, the magnifier indicator allows traders to switch to a different time frame without creating a new chart for the same instrument.

Order History
Order History indicator draws the historical trading activity, shows the entry and exit price and times and displays visual bands at the bottom of the charts, which indicates when you were in and out of the market.
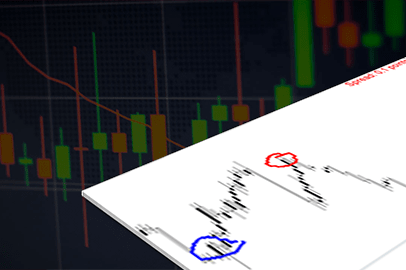
Freehand Drawing
A useful tool for trainers, presenters and trade leaders allows them to draw directly on the open chart and make notes in real-time. The tool is particularly useful for live webinars or distributing screenshots and chart files to people.

Bar Changer
The Bar Changer indicator creates an offline chart within the MT4 platform, a modified version of the current chart on which the indicator is used. This enables traders to customise bar dates such as the bars’ time and the display of the price.Additionally, the indicator allows focusing on a specific part of the day without the non-essential hours.
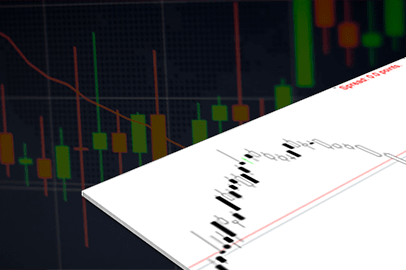
Keltner Channel
The Keltner Channel indicator track down the most important trends. It displays price envelops according to the volatility of a specific currency pair or trading asset price at a particular period.

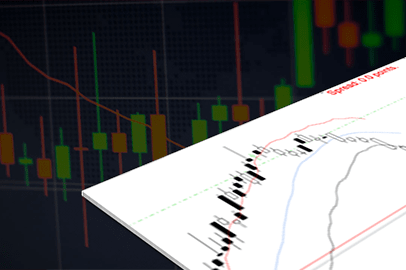
Donchian Channel
Developed by Richard Donchian, the indicator enables the trader to identify trends based on the intraday trends’ calculation. Additionally, this indicator uses variants – an average of the last N highs/lows.
Candle Countdown
The Candle Countdown indicator allows traders to follow the candlestick chart’s individual candles and identify when the current one will close and reopen. You can set up the indicator to alert you when the end of the bar approaches.